2022 National Report
Democracy Counts 2022, national NSLVE report on student participation in the 2022 U.S. midterm election.
Democracy Counts 2022, national NSLVE report on student participation in the 2022 U.S. midterm election.
This discussion guide helps start the conversation on data for the 2022 U.S. midterm election, Democracy Counts 2022.
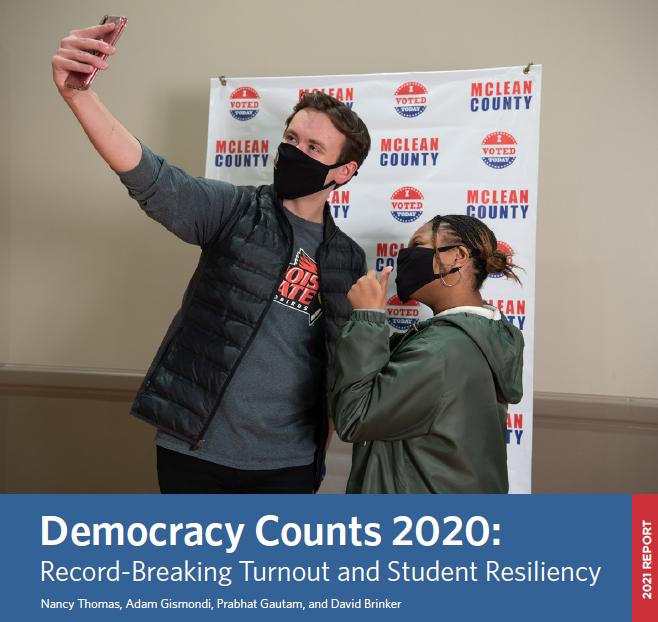
Democracy Counts 2020, national NSLVE report on student participation in the 2020 U.S. election.
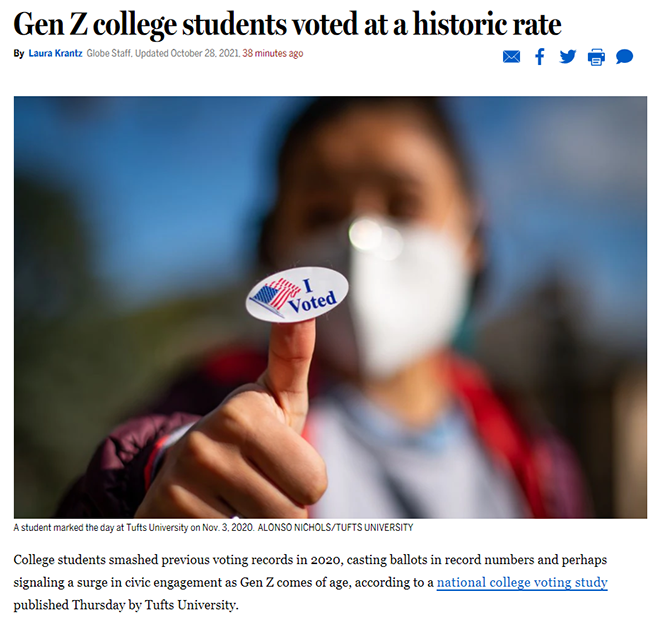
Read the Boston Globe's exclusive reporting on Democracy Counts and the 2020 NSLVE data.
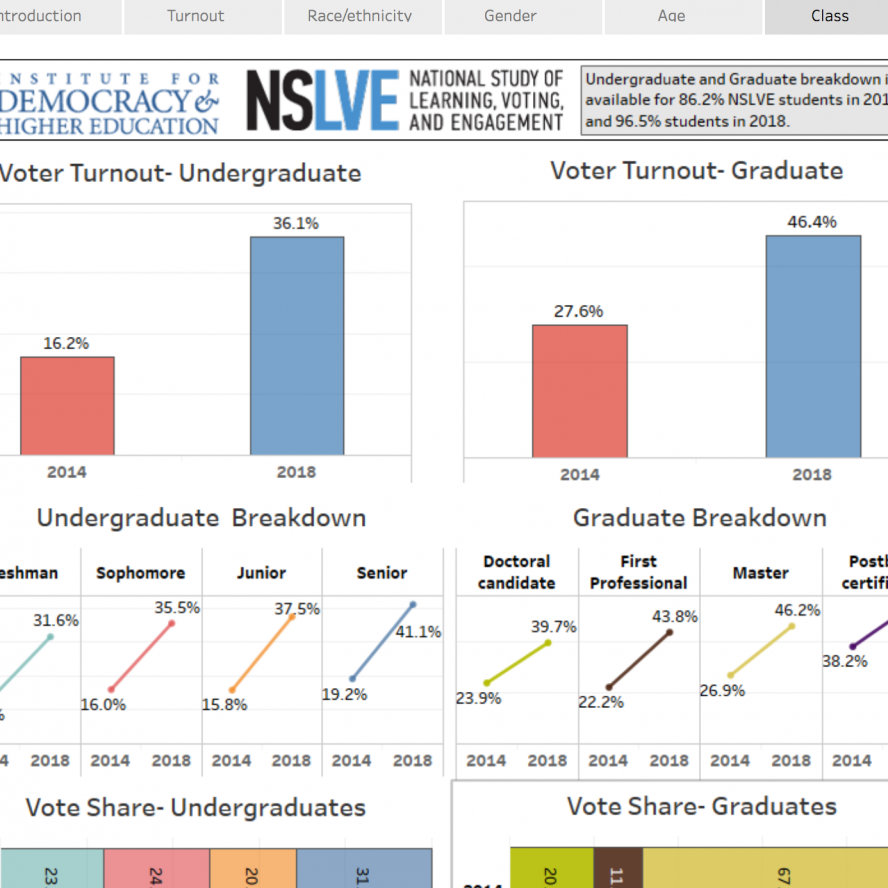
Explore the 2018 data in our interactive portal
Democracy Counts 2018, national NSLVE report on the 2018 midterm election

Read the Washington Post's exclusive feature on Democracy Counts 2018
For press inquiries or general questions, contact us at nslve@tufts.edu.
For campus discussions about Democracy Counts, ask for our short companion discussion guides.
For the 2016 election, our analysis was based on the voting records of 9,784,931 students at 1,023 higher education institutions. We found that 48.3% of all students in our study voted in the 2016 presidential election, with significant variations by race, gender, field of student, institution type, and more.
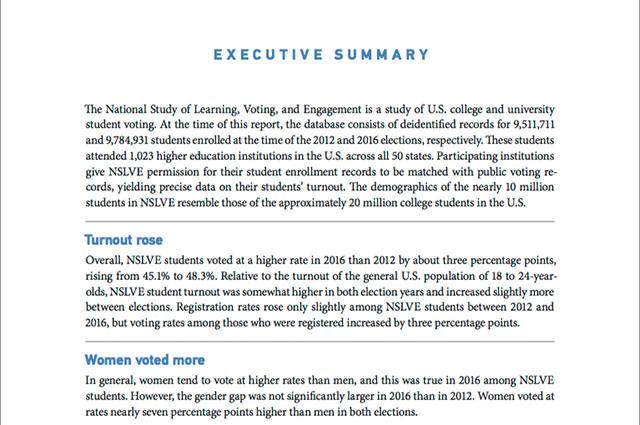
An executive summary of the 2012-2016 national report
The full national 2012-2016 report
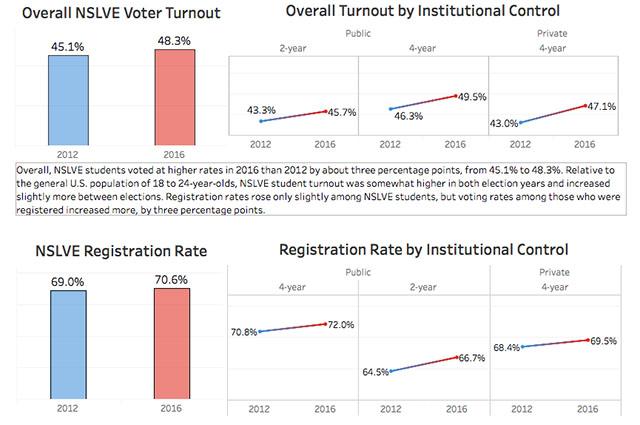
Explore the national NSLVE data in our new portal
For press inquiries or general questions, contact us at nslve@tufts.edu.
To speak with a specific NSLVE staff member, find their contact information here.